Introduction
2 minutes read
Some days you wake up and think, I want to visualize refraction !
but if you search for refraction simulations online, you’ll notice that they are often not very flexible, with IORs between 1 and 2 at most. This is enough for most glasses in the visible range ($\lambda \in [0.4, 0.8]$ µm), but certain materials take different values :
Germanium is widely used for thermal optics ($\lambda \in [3, 14]$ µm) and has an IOR around 4.
Metamaterials allow to shape the light in many ways. They can even be made to have a negative IOR1. They are made by creating periodic materials with patterns smaller than the wavelength of light.
So I decided that code that in Python, by making an interactive Matplotlib figure. 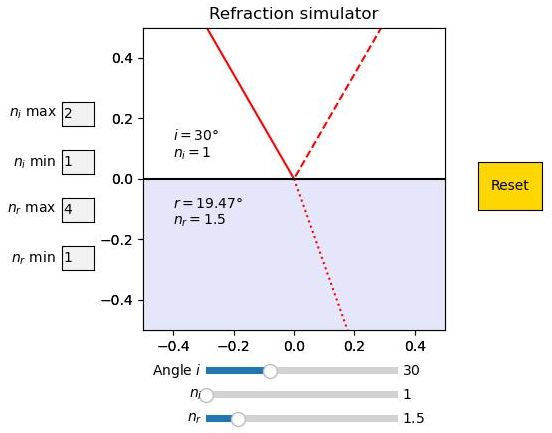
The code is explained in the following pages, but if you just want to use it, you can download the code by clicking the button below :
If you want to learn more, the website refractiveindex.info is a great source of information. It contains IOR measurements from lots of materials, taken from the scientific literature. Bending Back Light: The Science of Negative Index Materials, Costas M. Soukoulis, 2006. doi.org/10.1364/OPN.17.6.000016 ↩